Help
Below you can find a description of how to use 2Struc and 2StrucCompare, as well as an FAQ.
Submitting a job
Input: One PDB file uploaded from your computer or one PDB 4-letter code, then click Submit.
Results Page
-
Choose which chain you wish to see the results for using the dropdown menu on the top-left.
-
Below this you can choose to include or remove missing residues from the analysis. These are automatically parsed from the PDB header if present and are classified as "other".
-
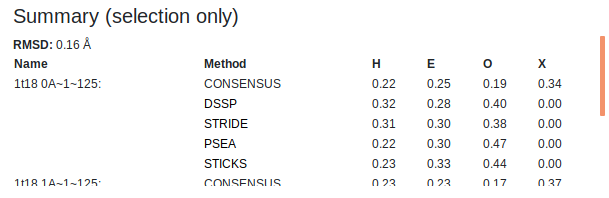
Summaries of the secondary structure fractions of the whole chain and the user defined selection are shown at the top of the page. This includes each of the active assignment methods as well as the consensus. "H" is helix, "E" is strand, "O" is other and "X" is undefined (when no consensus could be obtained).
-
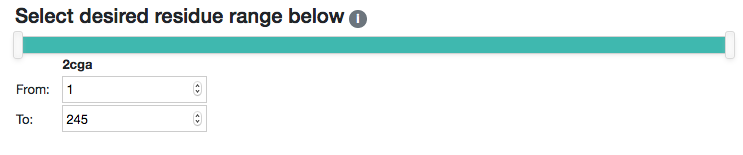
You can select the residue range to displace/analyse using the two-handed slider or the input boxes for greater precision. Deselected regions will be greyed out in the sequence viewer and will be hidden in the 3D viewer.
Sequence Viewer
-
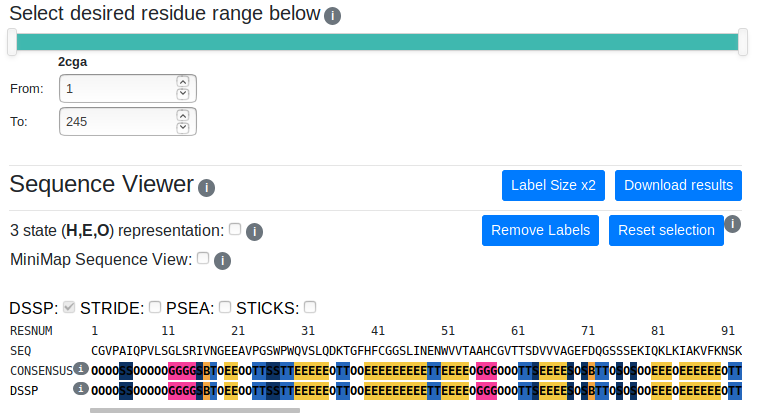
The sequence viewer displays the residue number, the one-letter amino acid code and the consensus and individual method secondary structure assignments. Long sequences can be viewed by scrolling horizontally.
-
Selection and deselection of specific residues can be achieved by clicking the residue of interest in the "SEQ" row. Multiple residues can be toggled by clicking and dragging along the sequence row, which will highlight affected residues in green.
-
Clicking a residue in any of the secondary structure rows will zoom and focus on that residue in the 3D viewer. Mousing over a residue will pop up a tooltip displaying the residue number.
-
The secondary structure rows are coloured according to each residues assigned class. For each method the class-colour mapping key can be seen by mousing over the i buttons.
-
You can select which methods to include in the analysis using the checkboxes. This will trigger recalculation of the consensus.
-
If an assignment method fails, the checkbox will be greyed out/disabled, and the method name will be coloured red.
-
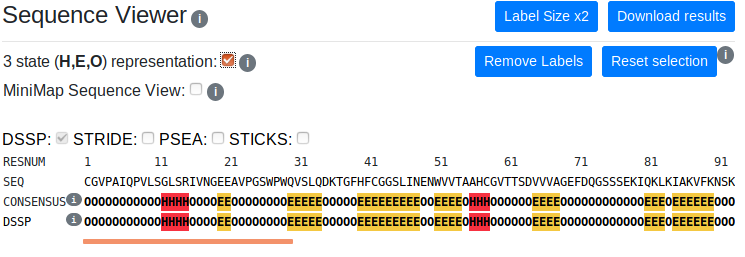
You can switch between full and three state representations of secondary structure using the checkbox. This will update the sequence viewer and 3D viewer colour schemes and trigger recalculation of the consensus. Mapping of full representation classes to the three state represenations for each method can be seen by mousing over the i buttons.
-
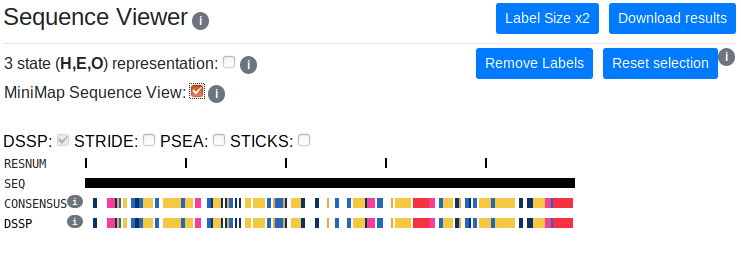
The MiniMap sequence view is useful if you are viewing large chains. It is a zoomed out view of the sequence and secondary structure assignments. All functionality of the full viewer is available in this mode.
-
Clicking the "Reset Selection" button will remove any selections applied by the user and recenter the protein in the 3D viewer.
-
Clicking the "Label Size" button will change the size of the labels in the 3D viewer.
-
Clicking the "Remove Labels" button will remove any labels added by the user in the 3D viewer.
-
An ASCII .csv file containing the results of the analysis can be downloaded by clicking the "Download Results" button. The files contents will reflect the choice of methods and selections made by the user.
3D Viewer
-
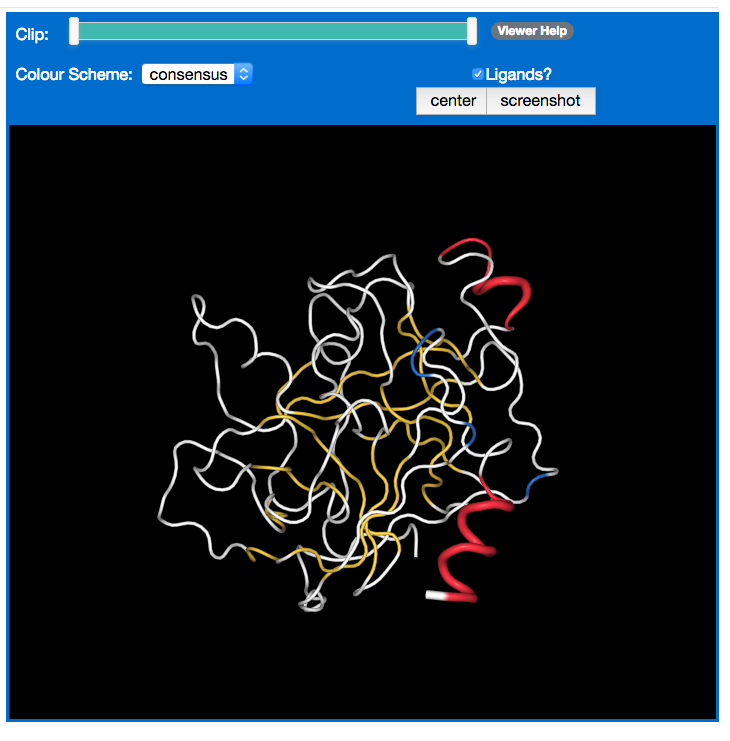
The 3D model of the currently selected chain is displayed in the 3D viewer.
-
The molecule can be rotated by clicking and dragging with the left mouse.
-
Holding the right mouse and moving the cursor pans the view.
-
Zooming can be achieved using the scroll wheel or equivalent e.g. two finger scrolling on a touchpad.
-
Mousing over an atom/residue will bring up a tooltip displaying information about the atom, residue and chain.
-
Holding Left-Ctrl and left clicking on an atom will label it with the residue name and number. Labels can be removed by the same method.
-
The clipping range of the camera can be controlled by using the two-handed slider.
-
The structure can be coloured according to its per residue secondary structure class from the consensus or the individual assignment methods. The colours are the same as that used in the sequence viewer. If a method has failed, it will not be available for colouring.
-
Display of ligands can be switched on and off using the checkbox.
-
The view can be centered on the whole molecule by clicking the "Center" button, or on specific residues by clicking them with the middle mouse button/wheel.
-
A .png image of the current view can be downloaded by clicking the "Screenshot" button. The image will not have a black background - instead it will have a transparent background making it suitable for use as a figure in presentations or for publication.
Submitting a job
Input: Two PDB files uploaded from your computer or two PDB 4-letter codes, or one PDB file (uploaded using the first file upload input) and one PDB code (entered into the first input), then click Submit. The Submit button will be disabled unless a viable combination of the above is input/uplaoded.
Pairing chains for analysis
-
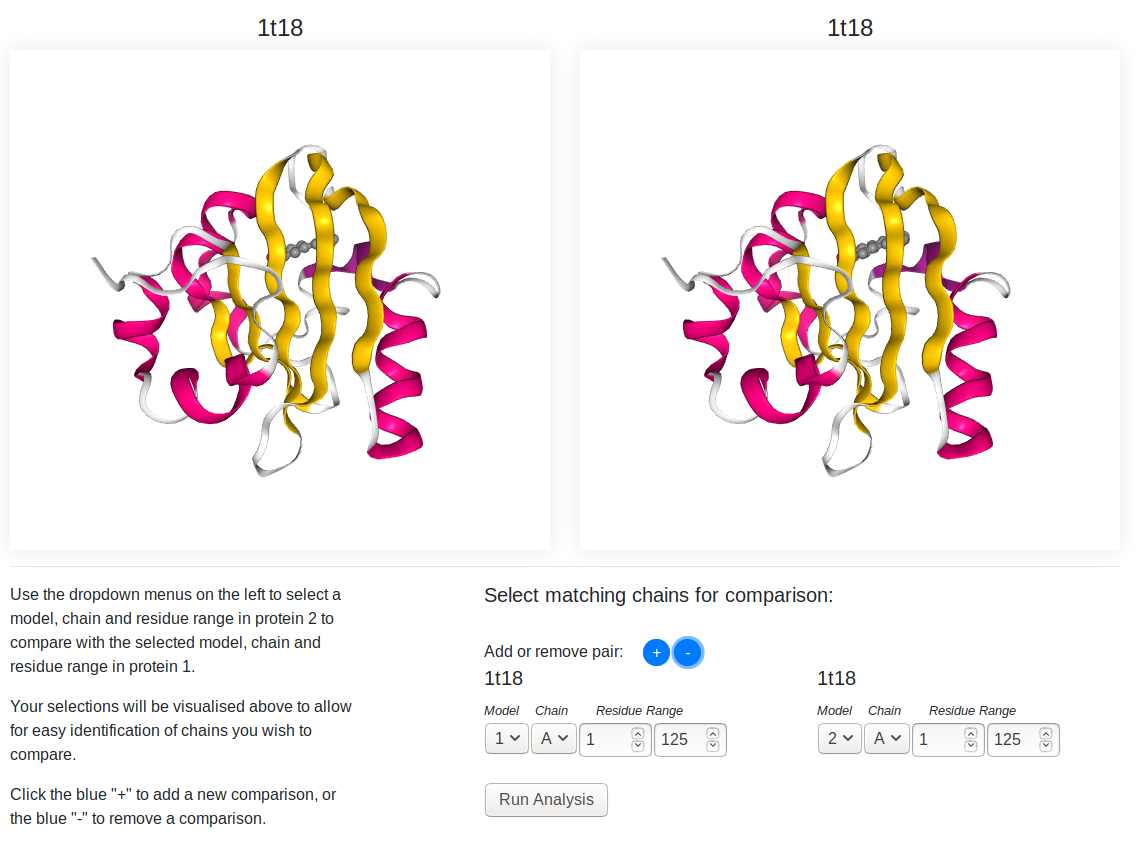
This page is used to choose the pairs of chains you want to analyse.
-
The two structures submitted for analysis are shown in the 3D viewers, protein A (the first protein submitted) on the left, protein B on the right. You can rotate (left click and drag), pan (right click and drag) and zoom (mouse wheel/two finger scroll) the structures using your mouse or touchpad.
-
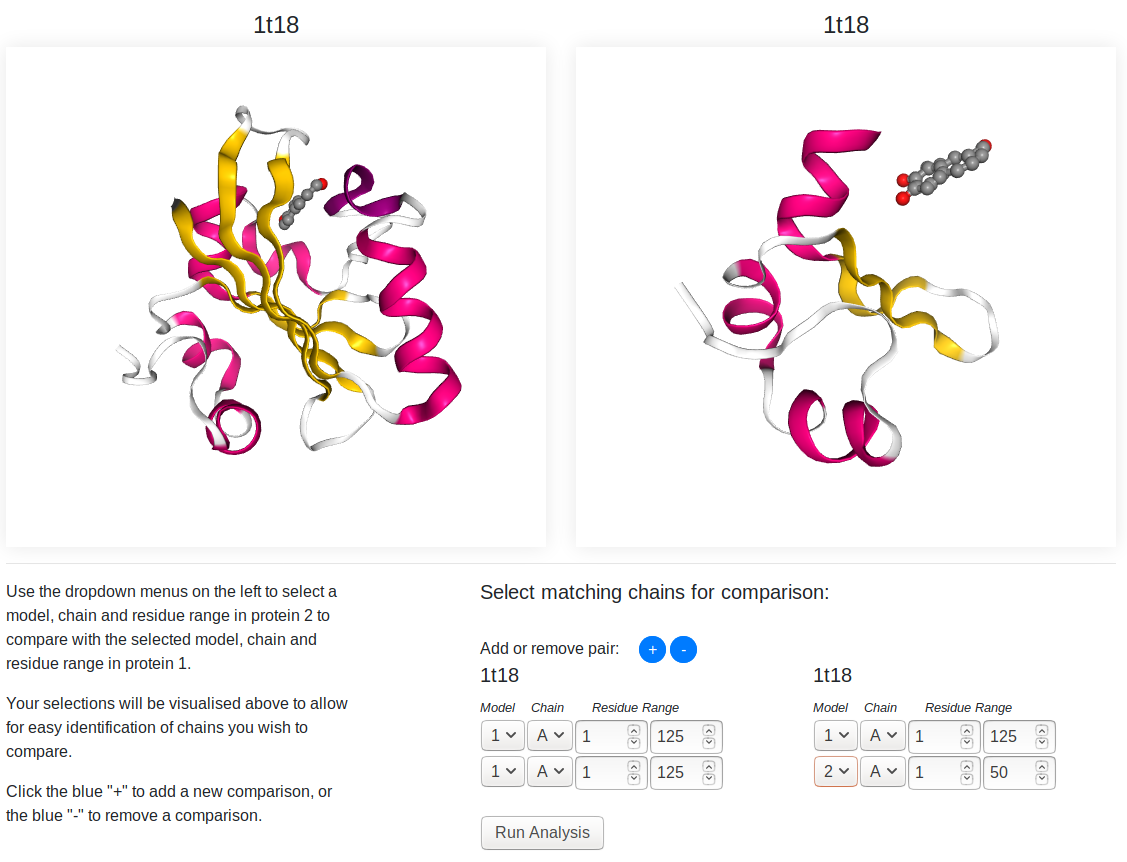
On the bottom right, you can select the pairs you want to analyse. You can choose the model, chain and residue range of each protein you wish to analyse. If you want to do additional comparison, you can click the blue "+" to add another row to the form. Clicking the blue "-" will remove the last comparison added from the list.
-
Changing the selection for either protein will alter the 3D representations of the proteins. Only the selected model/chain/residue range (and any associated ligands) will be visible in the preview windows, and the view will automatically center to this selection. This provides an easier view for checking the folds of these chains and ensuring they are the ones you wish to compare.
-
Once you have chosen your pairs, click the "Run Analysis" button to be taken to the results page.
Results Page
-
Choose which pair you wish to see the results for using the dropdown menu on the top-left.
-
Below this you can choose to include or remove missing residues from the analysis. These are automatically parsed from the PDB header if present and are classified as "other".
-
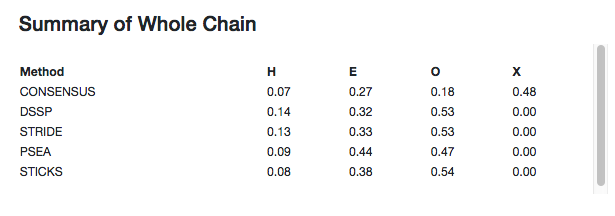
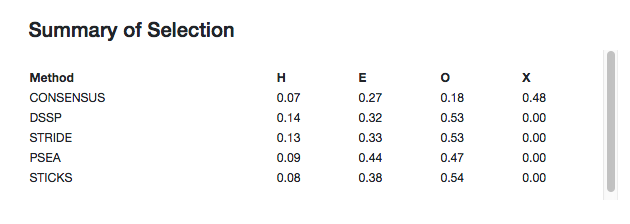
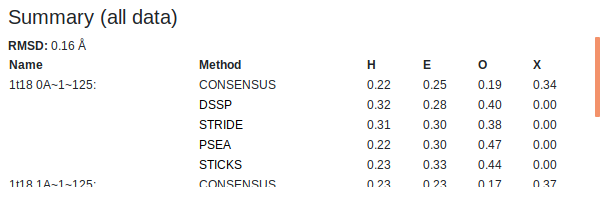
Summaries of the secondary structure fractions of the whole chain and the user defined selection for both analysed chains are shown at the top of the page. This includes each of the active assignment methods as well as the consensus. "H" is helix, "E" is strand, "O" is other and "X" is undefined (when no consensus could be obtained). Above these tables the RMSD (in Angstroms) of the aligned chain backbones is shown for the whole chains as well as the user defined selection.
-
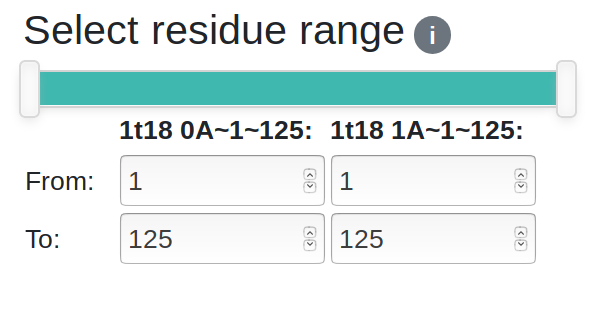
You can select the residue range to display/analyse using the two-handed slider or the input boxes for greater precision. There are two sets of input boxes, one for each chain. Changing any of the inputs will affect the selections of both chains. Deselected regions will be greyed out in the sequence viewer and will be hidden in the 3D viewer.
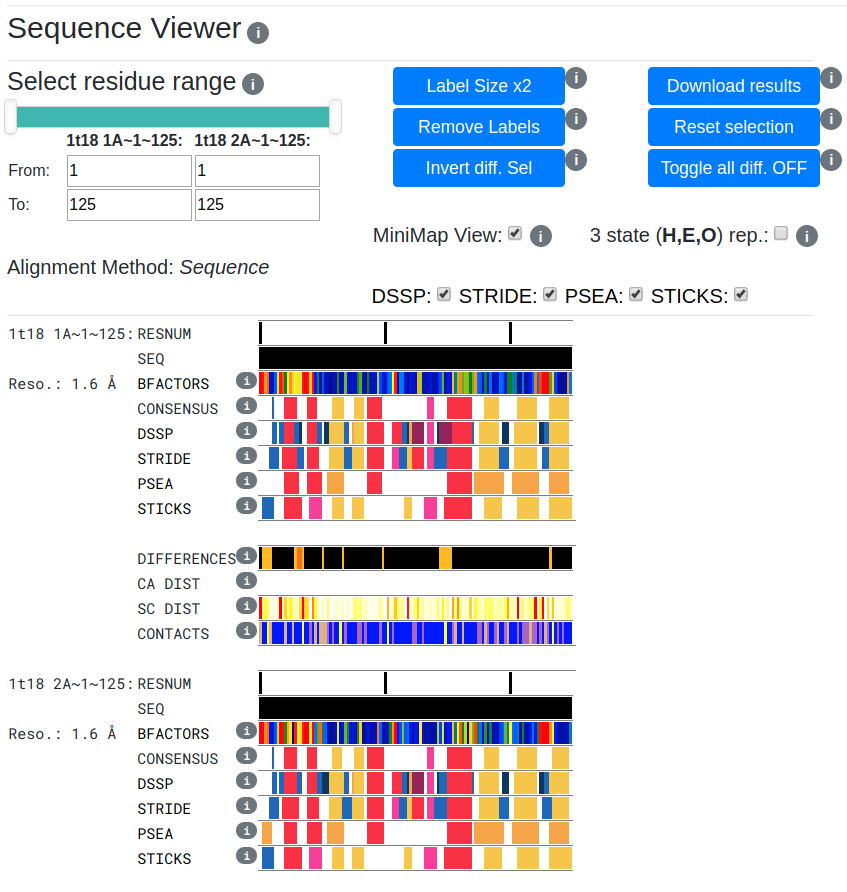
Sequence Viewer
-
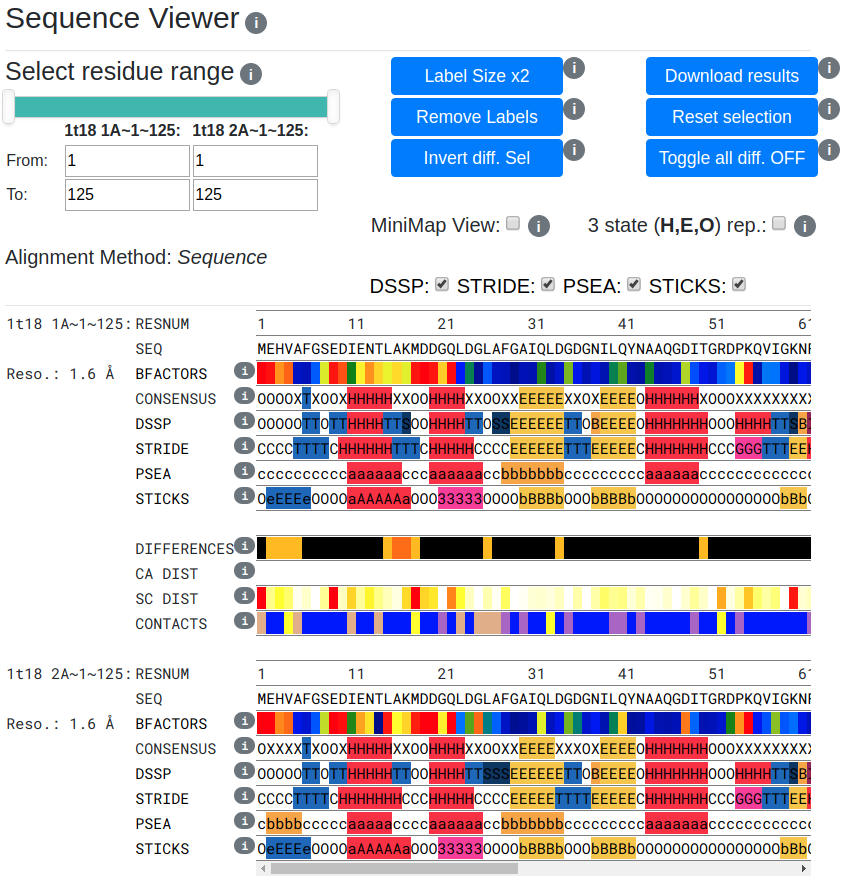
The sequence viewer displays the residue number, the one-letter amino acid code and the consensus and individual method secondary structure assignments for both chains, aligned by sequence or by structure depending on which alignment had the least gaps. It also includes the differences found in secondary structure assignments between both chains, as well as the per-residue deviations of aligned C-alpha atoms. Long sequences can be viewed by scrolling horizontally. Gaps in the alignment are indicated by "-".
-
The type of alignment method chosen to generate the optimal comparison is indicated just below the range selection input. It will either be "Sequence" or "Structural".
-
Selection and deselection of specific residues can be achieved by clicking the residue of interest in the "SEQ" row. Multiple residues can be toggled by clicking and dragging along the sequence row, which will highlight affected residues in green. This will effect the selection in both chains.
-
The resolution of each structure is indicated in the same row as the B-factors. If the structure does not have a resolution (e.g. it is an NMR structure, or an uploaded file does not contain this information) it will display "N/A".
-
The B-factor rows are coloured according to each residues percentile rank compared to other structures with the same resolution's average B-factors. This can be used as an indication of how significant the analysis for a specific residue is. For example, if a residue is coloured red in the B-factor row, that indicates that residue's B-factor is in the 95th percentile or higher for structures with the same resolution. This tells you that the atom positions for that specific residue are poorly resolved compared to what might be expected, so you might decide that any differences found for this residue are not reliable. Conversely, if it was blue that indicates the B-factors are much lower than expected for a structure with that resolution, so a difference is much more likely to be significant. The colour scale can be seen by mousing over the i buttons. If the structure being analysed does not have B factors e.g. it is an NMR structure or a computationally generated model, the B-factor row will be coloured black and the "BFACTOR" row label will be coloured red.
-
Clicking a residue in any of the secondary structure rows or the B-factor row will zoom and focus on that residue in the 3D viewer. Mousing over a residue will pop up a tooltip displaying the residue number.
-
The secondary structure rows are coloured according to each residues assigned class. For each method the class-colour mapping key can be seen by mousing over the i buttons.
-
The difference row is coloured to indicate the proportion of currently selected methods that classified that residue's secondary structure differently. Black indicates there were no differences. A scale from yellow to red indicate differences were found - red indicating all methods predicted a different class. Gaps in the alignment are coloured black.
-
Selection and deselection of differences can be achieved by clicking the residue of interest in the "DIFFERENCES" row. Multiple residues can be toggled by clicking and dragging along the sequence row, which will highlight affected residues in green. This can be useful to remove differences that might not be of interest to you from the protein in the 3D viewer for production of figures or easier analysis. Deselecting differences in this manner is seperate to the main selection functionality - the residue will still be visible in the 3D viewer and only the specific residue in the difference row will be greyed out in the sequence viewer. However, the sidechain representation of that residue will not appear in the 3D viewer until you reselect it in the sequence viewer, or switch on visualisation of all sidechains using the "Sidechains?" checkbox. The residue will no longer be coloured as a difference in the 3D viewer if deselected, instead being coloured white.
-
The C alpha distances row is coloured to indicate the per-residue distance between aligned C-alphas. This scale goes from white (0 Angstrom distance) through yellow to red (>5 Angstrom distance). Gaps in the alignment are coloured black.
-
The side chain distances row is coloured to indicate the per-residue distance between aligned sidechains. This scale goes from white (0 Angstrom distance) through yellow to red (> (75% of the worst resolution structure being compared) Angstrom distance). Gaps in the alignment are coloured black. Only residues with the same amino acid type are compared in this manner, else the distance is set to 0.
-
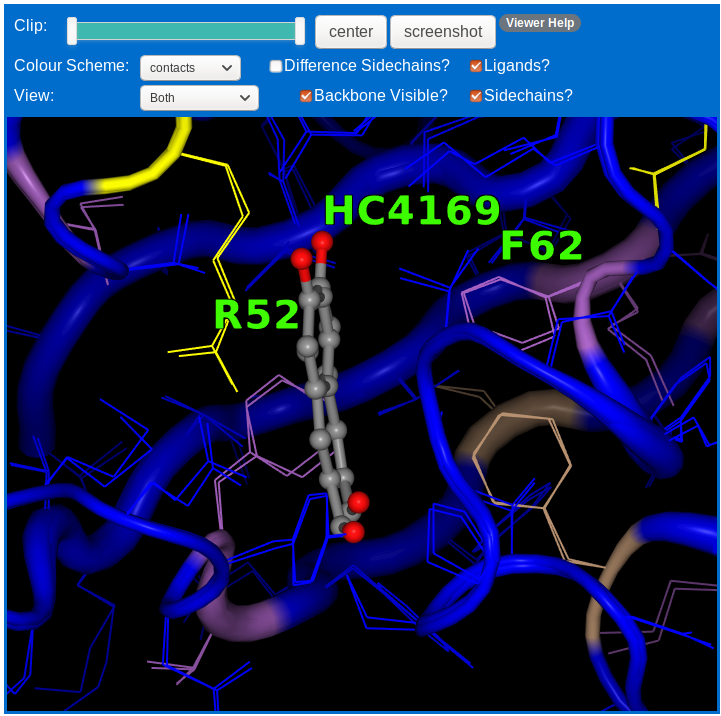
The contacts row is coloured to indicate the change in contacts between aligned sidechains. This is the number of contacts not found in BOTH the chains. This scale goes from blue (no change in contacts) through yellow to red (> 6 different contacts). Gaps in the alignment are coloured black.
-
You can select which methods to include in the analysis using the checkboxes. This will trigger recalculation of the consensus and differences.
-
If an assignment method fails, the checkbox will be greyed out/disabled, and the method name will be coloured red.
-
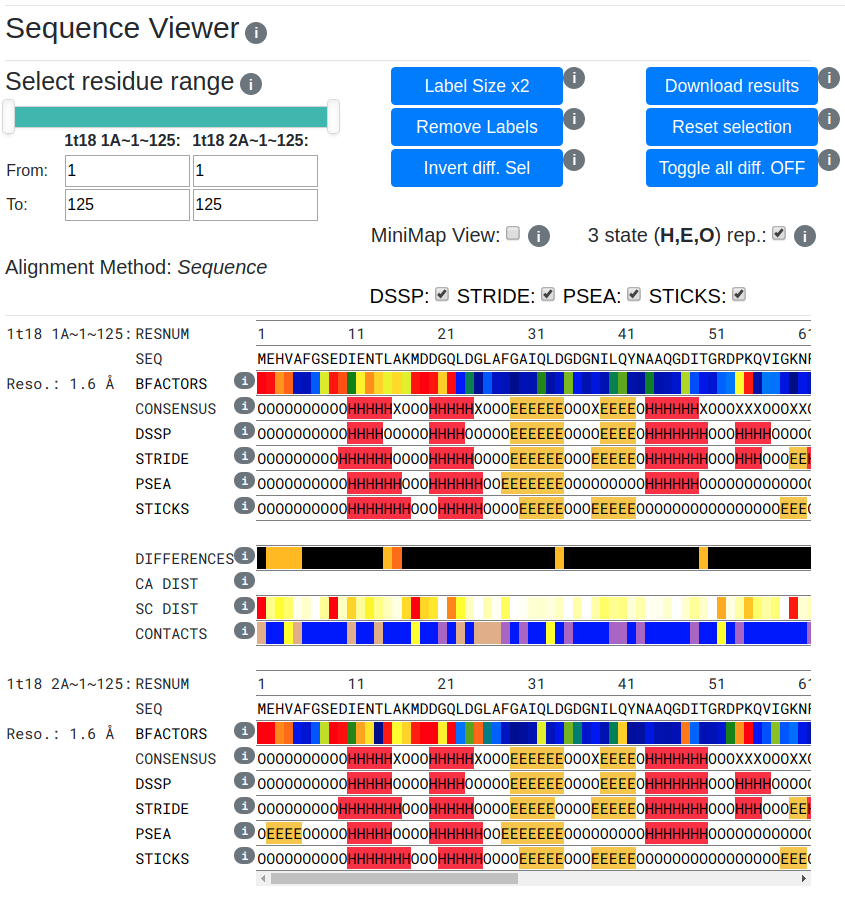
You can switch between full and three state representations of secondary structure using the checkbox. This will update the sequence viewer and 3D viewer colour schemes and trigger recalculation of the consensus and differences. Mapping of full representation classes to the three state represenations for each method can be seen by mousing over the i buttons.
-
The MiniMap sequence view is useful if you are viewing large chains. It is a zoomed out view of the sequence and secondary structure assignments. All functionality of the full viewer is available in this mode.
-
Clicking the "Remove Labels" button will remove any labels added by the user in the 3D viewer.
-
Clicking the "Label Size" button will change the size of the labels in the 3D viewer.
-
Clicking the "Reset Selection" button will remove any selections applied by the user (including difference deselections) and recenter the protein in the 3D viewer.
-
Clicking the "Invert diff. Sel" button will make all differences currently deselected selected, and vice versa.
-
Clicking the "Toggle all diff. ON/OFF" button will turn all the differences on or off. The button text will change to indicate whether a click will turn the differences on or off i.e. will say "Toggle all diff. ON" if clicking will turn all the differences on.
-
An ASCII .csv file containing the results of the analysis can be downloaded by clicking the "Download Results" button. The files contents will reflect the choice of methods and selections made by the user. Click here for an example.
3D Viewer
-
The 3D model of the currently selected, aligned pair of chains is displayed in the 3D viewer.
-
The molecules can be rotated by clicking and dragging with the left mouse.
-
Holding the right mouse and moving the cursor pans the view.
-
Zooming can be achieved using the scroll wheel or equivalent e.g. two finger scrolling on a touchpad.
-
Mousing over an atom/residue will bring up a tooltip displaying information about the atom, residue and chain.
-
Holding Left-Ctrl and left clicking on an atom will label it with the residue name and number. Labels can be removed by the same method.
-
The clipping range of the camera can be controlled by using the two-handed slider.
-
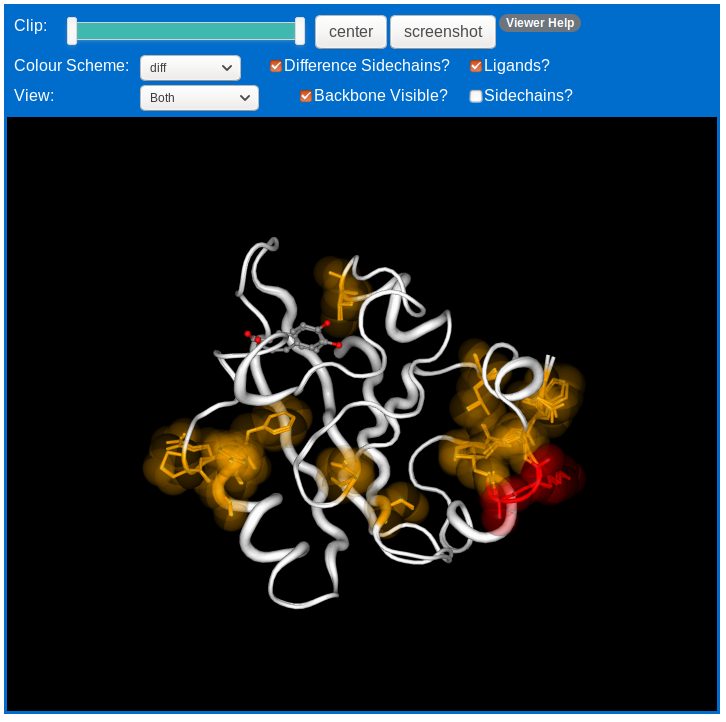
The structure can be coloured to show a variety of information. It can be coloured by the differences found, or by the per-residue C-alpha or sidechain distances, or by difference in contacts. It can be coloured by its per residue secondary structure class from the consensus or the individual assignment methods. It can also be coloured by chain (protein A chain in green, B chain in purple), B-factor percentile rank or by the CPK colour scheme to color displayed sidechains by atom-type. The colours are the same as that used in the sequence viewer. The default colour-scheme is the difference scheme.
-
By default the sidechains of residues for which a difference has been found are displayed as licorice representation with a translucent spacefill. You can toggle this on and off using the "Difference Sidechains?" checkbox.
-
You can also switch on and off the display of ALL sidechains using the "Sidechains?" checkbox. This and the "Difference Sidechains?" checkboxes work independently - so checking "Difference Sidechains?" and unchecking "Sidechains?" will result in the sidechains for residues where a difference has been found being displayed.
-
If you only wish to display the residues that are different and remove the rest of the protein backbone, you can do so using the "Backbone Visible?" checkbox.
-
Using the "View" dropdown menu, you can choose to view both, or either of the chains being compared alone. Chains are identified by the file name or PDB code of the protein they are from.
-
Display of ligands can be switched on and off using the checkbox.
-
The view can be centered on the whole molecule by clicking the "Center" button, or on specific residues by clicking them with the middle mouse button/wheel.
-
A .png image of the current view can be downloaded by clicking the "Screenshot" button. The image will not have a black background - instead it will have a transparent background making it suitable for use as a figure in presentations or for publication.